


Libraries Are More Popular Than Ever and Library Workers Don’t Earn Livable Wages: The State of U.S. Public Libraries
A new look at annual data provided by the Institute of Museum and Library Services’s annual Public Libraries Survey by the website WordsRated, a non-commercial research organization focused on books, reading, and publishing, offers an expansive view of the state of U.S. public libraries since 1992 Among some of the key findings are that in-person library usage is down while the popularity of library use — thanks to digital access — is at its highest. Libraries rely less on government funding than they ever have before and, perhaps as a result, pay their workers less than a livable wage.
The full study can be accessed via WordsRated. The team explored over 12.5 million data points, compiling three decades’ worth of work to distill trends, insights, and shifts in U.S. public library usage. Here’s a look at the highlights.
Note that all of this data is pre-COVID.
Are Libraries Dying?
According to the numbers, the answer is no. What has changed though, is how citizens are using their libraries.
The peak year for in-person library usage was 2009, with 1.59 billion visitors. That number was up by over 34% since 1992. Since 2009, though, visits in person have declined by 21%, with 1.25 billion in-person library visits in 2019.
There’s an average of 3.85 visits per person in the U.S.
It’s not just in-person visits that have declined. So, too, have book checkouts. There’s been a small decrease, though, with 1.83 billion physical items borrowed in 2019.
Anyone who has spent time with public libraries, especially in the last decade, knows that digital access has seen tremendous growth. WordsRated found total library collection use — that is, both physical and digital — reached an all-time high of 2.98 billion in 2019. That accounts for a 153% growth in digital collections since 2013.
2019 was also the peak for having a library card: There were 174.23 million registered cardholders across the U.S. In other words, almost 54% of all Americans have a library card.
Libraries are far from dying.
What Are People Borrowing and Doing at Libraries?
Collection Use
In 2019, the average library card holder used almost 17 items each year. This is an increase of almost 11% since 2014..
Library collection sizes are up since then as well, with a peak of 1.88 billion items in 2018 (and a moderate decrease to 1.77 billion in 2019 — this may be due to changes in ebook lending challenges, among other digital rights related reasons). Digital collections account for more than half of library collections.
In 2009, non-digital materials made up 98% of a library’s collection. In 2019, that number was 45%.
It comes as no surprise, then, that physical books no longer comprise the bulk of library collections. They now account for roughly 39% of the collection, while ebooks now equate to 1/3 of the collection. Physical and digital audio are about 25% of the collection, while the remainder of the collection comes from video.
Use of digital collections is at an all-time high of 37%. This is triple what it as in 2013. There’s little surprise in noting that while ebook collections increased, so, too, did their use. Subsequently, the decline in physical books is related to the decline in physical book borrowing.
But in terms of borrowing, more physical books are borrowed than digital ones, with roughly 5.6 physical books borrowed per person per year and 3.5 digital.
Programming
Library programming has doubled since 2004, with nearly 6 million library programs offered in 2019. Over half of those programs are for kids, and programs for young adults have grown fastest, with a 40.5% growth in offerings since 2014. Public libraries averaged about ten programs per 1,000 people.
Bonus: more people are attending library programs than ever before. 125.5 million people attended programs, up over 23% since 2014.
In other words, 21 people on average attend each library program. Programs account for 10% of all visits to libraries. Data suggest, too, that library programming not only accounts for visits to the library but also their circulation per person.
Libraries are filling significant technology needs in their communities as well, including via wifi. Further data on library technology is available in the full report.
Public Libraries and Money
The Big Picture
2019 was the most expensive year to run a library, with a total cost across the country of $13.4 billion dollars. The average operating expenses per library was roughly $766,000, an increase over 2014. None of this is surprising, given the increase cost of all goods and services during this time.
The cost above is a tripling of expenses since 1992.
Library administrative costs — AKA the staff — were the highest of all. Those accounted for 66% of all expenses.
Library collections accounted for $1.45 billion in 2019, the highest on record. Ebooks and digital audiobooks account for a third of those costs.
The average price of an item in the collection was $.81, nearly 40% lower than in 2010. The average cost of a physical book increased since 2003 by 10%, but the cost per item for digital dropped. Dig into more of the details on the cost per item and cost per use, especially for digital materials in the full report. Ebooks and digital audiobooks have been a pain point for public libraries, particularly in the last five years, as access and subscription models make them a premium product purchase.
Government Funding
The government hasn’t been able to fully fund public libraries in 27 years. As costs for libraries increased, subsequent funding did not. Eighty-six percent of funding comes from local governments, while the remainder is made up through grants, gifts, donations, and other such efforts.
Federal funding is at the lowest level it has ever been, though state funding for libraries has been increasing. Grants, gifts, donations, and other efforts, however, still provide more funding than state government.
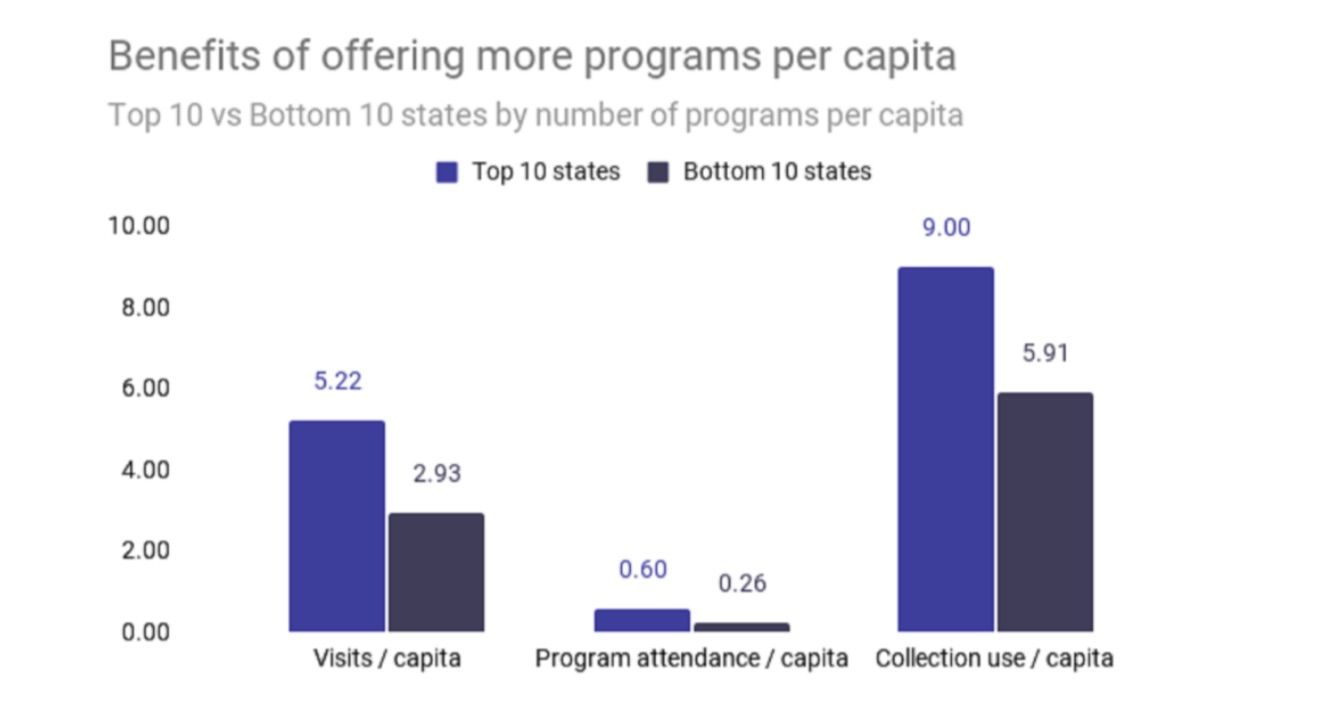
Libraries that are better funded are, of course, better used. The top ten states for library funding, compared to the bottom ten states, saw:
● 9.93% more registered borrowers per capita
● 73.31% more programs per capita
● 81.76% higher program attendance per capita
● 122.49% higher total collection use per capita
● 126.70% higher physical collection use per capita
● 113.52% higher digital collection use per capita
● 104.31% more kids books borrowed per capita
Library Worker Wages
Although there have never been more public libraries in the U.S. — nearly 17,500, or an average of 5.4 libraries per 100,000 people — wages for library workers lags. There are roughly 144,600 library workers across the country, of which 35.4% are librarians (and only 2/3 of those with a master’s degree in library science, about 34,000).
The average library staff person in the U.S. in 2019 earned $44,700 before taxes. The average salary may have increased in the past decade, but that number still represents library staff being paid 35% below a living wage for a family of three, made up of two working adults and one child.
Only three states pay library workers a living wage on average. Those states are Washington, Nevada, and California.
We Like Libraries But Don’t Want To Pay For Them
Though the data in this study is what’s reported annually, WordsRated’s compilation is a clear-eyed look at how much libraries have grown, adapted, and met the needs of people across the country.
But unfortunately, those working within those libraries have yet to be paid for that hard, engaged, and necessary work.