The Great 2014 Reading Habits Survey: The Results
In our first reader poll of 2015, we got all kinds of curious about your reading habits last year. 2511 awesome Riot readers responded, and it took us a while to dig through all the juicy data. And we’re still going! This post presents the reading and spending habits of the Riot readers who responded to the survey.
Before we dig in, it’s important to know that we have no way of knowing how representative (or not) the readers who opted in to this survey are of the general Book Riot audience, and no way of verifying these self-report numbers. But we trust our readers and have no reason to think they would lie in an anonymous survey, so. Let’s do this!
How many books did you read in 2014?
2486 usable responses
Range: 1-805
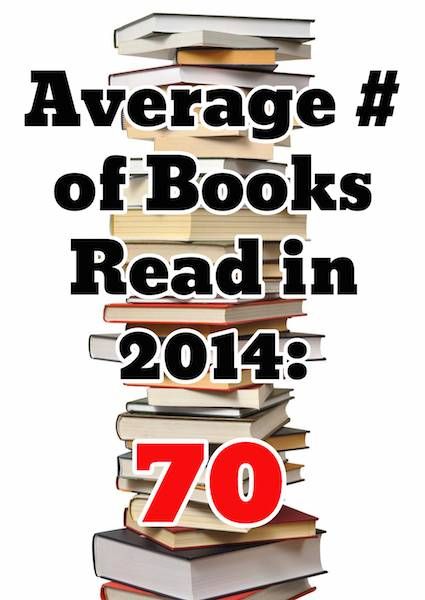
Mean: 69.93 (rounded up to 70)
Median: 55
Mode: 30
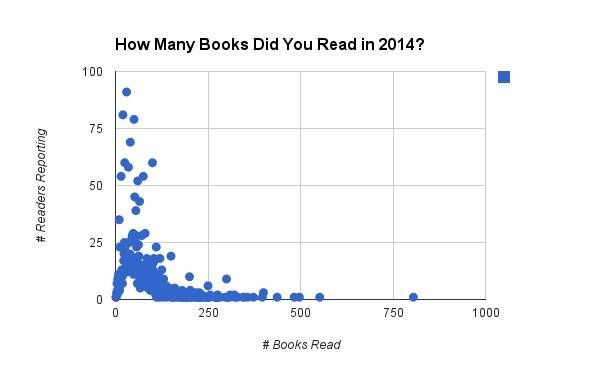
So, more readers reported reading 30 books than any other quantity, and the readers right in the middle of the group reported 55. The average was driven up by some outliers.
Check out the full distribution:
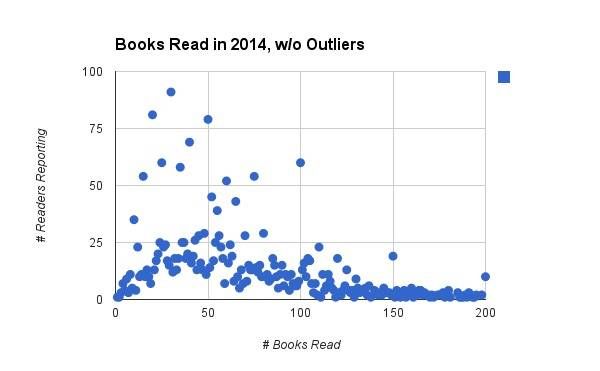
You get the general idea above, but here’s a look at what happens when we remove the 86 readers who reported reading more than 200 books last year. This makes it much easier to see the spike at 30 and the clustering around other round numbers, as well as how the number of readers reporting a quantity tends to decrease as the quantity of books increases.
Now let’s talk about format!
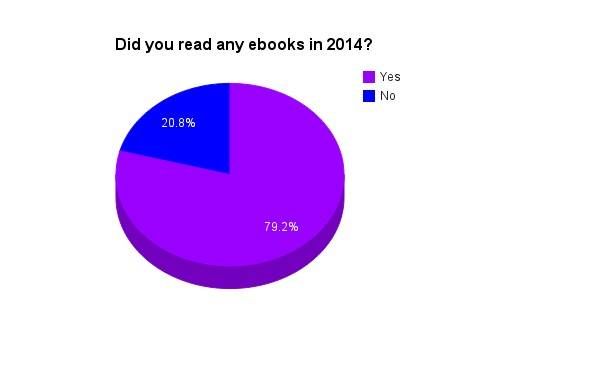
Did you read any ebooks in 2014?
2467 responses
The proportion of Book Riot readers who read any ebooks is up over 2013’s 74.9% response. Both are remarkably higher than the 28% rate for the general American adult population (per the Pew Research Center’s 2013 study).
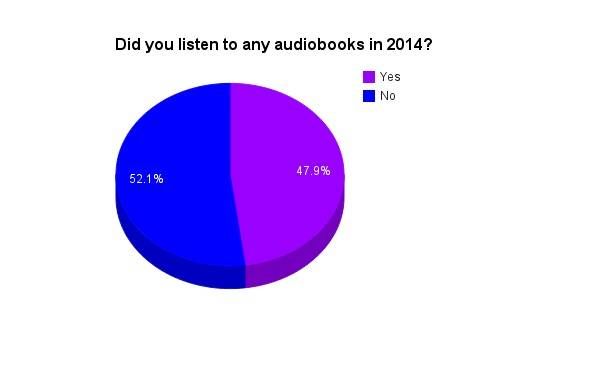
Did you listen to any audiobooks in 2014?
2449 responses
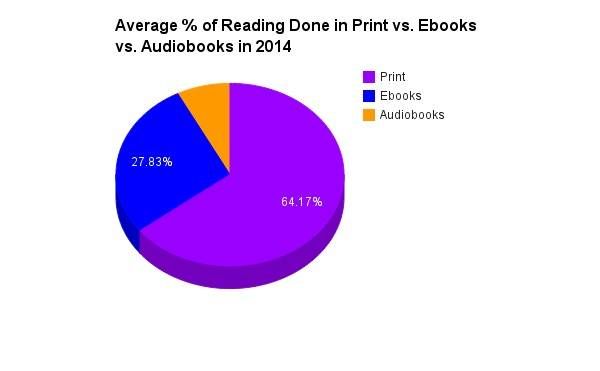
What percentage of your 2014 reading was in print? Ebooks? Audiobooks?
2393 responses
On average the Book Riot readers in this survey did 64.17% of their reading in print, 27.83% in ebooks, and 7.55% with audiobooks.
Also interesting: 348 readers (14.5%) reported reading exclusively in print; 45 readers (1.8%) reported reading exclusively ebooks; and 4 readers (0.17%) reported reading exclusively with audiobooks. So, only 16.47% of these Book Riot readers read exclusively in one format, and the vast majority use some combination of print, ebooks, and audiobooks.
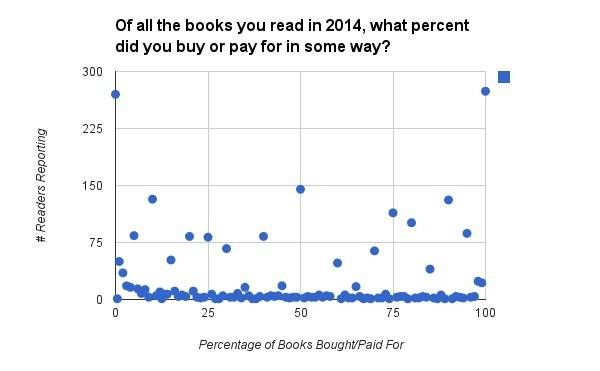
Of all the books you read in 2014, what percent did you buy or pay for in some way (i.e. through a subscription service)?
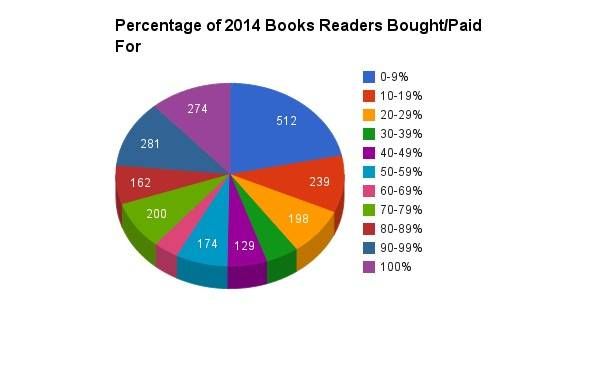
Range: 0-100%
Mean: 47.76%
The largest pieces of the pie come from readers who bought very few (0-9%) of the books they read last year (512) and readers who bought almost all (90-99%) or all (100%) of the books they read last year (281 and 274, respectively, for a total of 555). A look at the distribution shows how pronounced the spikes at each end of the spectrum are.
Okay, now let’s talk cash.
How much did you spend on books in 2014?
2261 usable responses
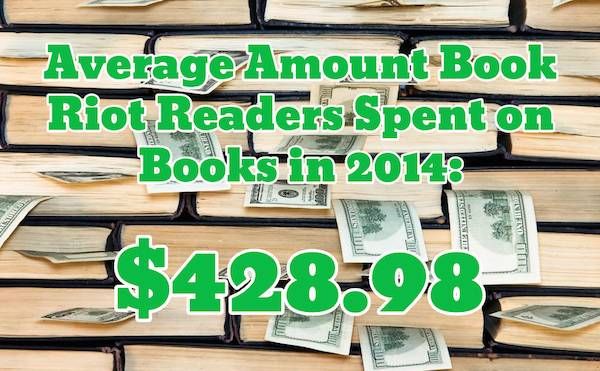
Mean: $428.98
Median: $200
Mode: $200
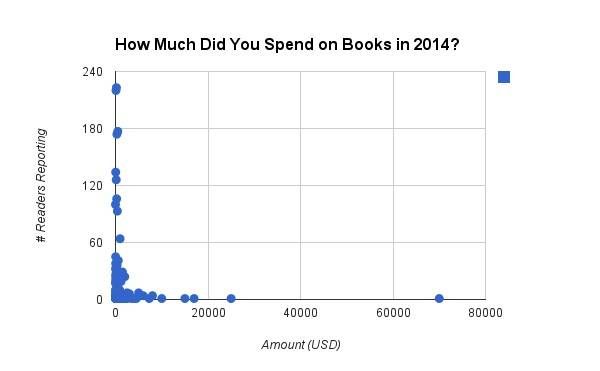
Here’s the whole distribution, which is so affected by a few outliers that it’s basically useless to us.
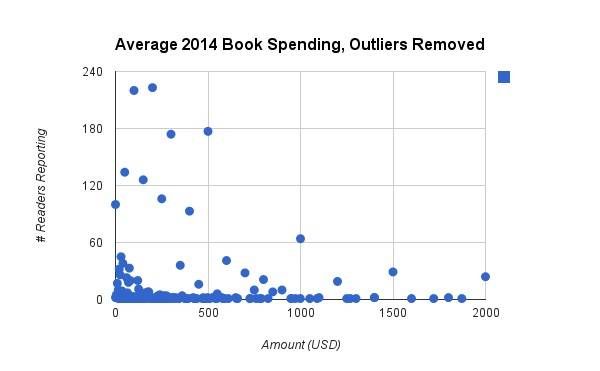
We can get a better look at what’s going on by removing the 19 readers who reported spending more than $2,000.
Exactly 100 readers reported spending $0 on books in 2014. From there, we can see the spike at $200 (the mode, reported by 223 readers) and other round numbers. In self-report surveys like this, we often see clustered responses at round numbers, which I suspect comes from readers who do not track their spending down to the dollar estimating instead. (For instance, 2 readers reported spending $49; 143 readers reported spending $50.)
Any thoughts or questions? Where do your habits fall in relation to these averages?
Stay tuned for the next installment of survey results, in which we’ll look at where Riot readers get their books!
____________________

